Back to the 2020-21 Annual Report
Financial Performance
Financial performance at a glance
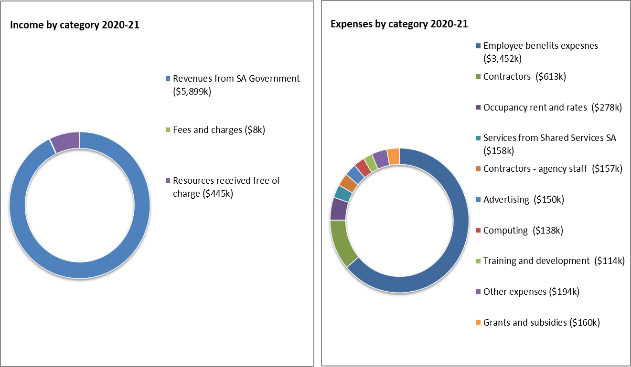
The following table and charts provide a brief summary of the overall financial position of the CEIH. The information is unaudited. Full audited financial statements for 2020-21 are attached to this report.
Note: The 2020-21 financial summary has been prepared based on a 12-month period. The comparative period for 2019-20 is based on a 6 month period from the date of the establishment of the CEIH on 6 January 2020 to 30 June 2020.
The CEIH financial summary
| Financial summary ($000) | 2020-21 | % (+ / - ) | 2019-20 |
|---|---|---|---|
Total income | 6 352 | +36.4% | 4 656 |
Total expenses | 5 414 | +26.6% | 4 275 |
Net result for the period | 938 | +146.2% | 381 |
Net cash provided by operating activities | 938 | +146.2% | 988 |
Total assets | 2 205 | +79.4% | 1 229 |
Total liabilities | 1 518 | +2.6% | 1 480 |
Net assets | 687 | +373.7 | (251) |

Consultants disclosure
The following is a summary of external consultants that
have been engaged by the Commission, the nature of work undertaken, and the actual
payments made for the work undertaken during the financial year.
Consultancies with a contract value below $10,000 each
Consultancies | Purpose | $ Actual payment |
All consultancies below $10,000 each - combined | n/a | Nil |
Consultancies with a contract value above $10,000 each
Consultancies | Purpose | $ Actual payment |
All consultancies above $10,000 each - combined | n/a | Nil |
Data for previous years is available via: Data SA website
See also the Consolidated Financial Report of the Department of Treasury and Finance for total value of consultancy contracts across the South Australian Public Sector.